Working with Log Files
Traffic Server generates log files that contain information about every request it receives and every error it detects. This chapter will examine the various log features, the configuration formats and also examine the various pre-defined log formats that are available.
Understanding Traffic Server Log Files
Traffic Server records information about every transaction (or request) it processes and every error it detects in log files. Traffic Server keeps three types of log files:
Error log files record information about why a particular transaction was in error.
Event log files (also called access log files) record information about the state of each transaction Traffic Server processes.
System log files record system information, including messages about the state of Traffic Server and errors/warnings it produces. This kind of information might include a note that event log files were rolled, a warning that cluster communication timed out, or an error indicating that Traffic Server was restarted.
All system information messages are logged with the system-wide logging facility syslog under the daemon facility. The syslog.conf(5) configuration file (stored in the /etc directory) specifies where these messages are logged. A typical location is /var/log/messages (Linux).
The syslog(8) process works on a system-wide basis, so it serves as the single repository for messages from all Traffic Server processes (including traffic_server, traffic_manager, and traffic_cop).
System information logs observe a static format. Each log entry in the log contains information about the date and time the error was logged, the hostname of the Traffic Server that reported the error, and a description of the error or warning.
Refer to Error Messages for a list of the messages logged by Traffic Server.
By default, Traffic Server creates both error and event log files and records system information in system log files. You can disable event logging and/or error logging by setting the configuration variable proxy.config.log.logging_enabled (in the records.config file) to one of the following values:
- 0 to disable both event and error logging
- 1 to enable error logging only
- 2 to enable transaction logging only
- 3 to enable both transaction and error logging
Understanding Event Log Files
Event log files record information about every request that Traffic Server processes. By analyzing the log files, you can determine how many people use the Traffic Server cache, how much information each person requested, what pages are most popular, and so on. Traffic Server supports several standard log file formats, such as Squid and Netscape, as well as user-defined custom formats. You can analyze the standard format log files with off-the-shelf analysis packages. To help with log file analysis, you can separate log files so they contain information specific to protocol or hosts. You can also configure Traffic Server to roll log files automatically at specific intervals during the day or when they reach a certain size.
The following sections describe the Traffic Server logging system features and discuss how to:
Manage your event log files
You can choose a central location for storing log files, set how much disk space to use for log files, and set how and when to roll log files. Refer to Managing Event Log Files.
Choose different event log file formats
You can choose which standard log file formats you want to use for traffic analysis, such as Squid or Netscape. Alternatively, you can use the Traffic Server custom format, which is XML-based and enables you to institute more control over the type of information recorded in log files. Refer to Choosing Event Log File Formats.
Roll event log files automatically
Configure Traffic Server to roll event log files at specific intervals during the day or when they reach a certain size; this enables you to identify and manipulate log files that are no longer active. Refer to Rolling Event Log Files.
Separate log files according to protocols and hosts
Configure Traffic Server to create separate log files for different protocols. You can also configure Traffic Server to generate separate log files for requests served by different hosts. Refer to Splitting Event Log Files.
Collate log files from different Traffic Server nodes
Designate one or more nodes on the network to serve as log collation servers. These servers, which might be standalone or part of Traffic Server, enable you to keep all logged information in well-defined locations. Refer to Collating Event Log Files.
View statistics about the logging system
Traffic Server provides statistics about the logging system; you can access these statistics via Traffic Line. Refer to Viewing Logging Statistics.
Interpret log file entries for the log file formats
Refer to Example Event Log File Entries.
Managing Event Log Files
Traffic Server enables you to control where event log files are located and how much space they can consume. Additionally you can specify how to handle low disk space in the logging directory.
Choosing the Logging Directory
By default, Traffic Server writes all event log files in the logs directory located in the directory where you installed Traffic Server. To use a different directory, refer to Setting Log File Management Options.
Controlling Logging Space
Traffic Server enables you to control the amount of disk space that the logging directory can consume. This allows the system to operate smoothly within a specified space window for a long period of time. After you establish a space limit, Traffic Server continues to monitor the space in the logging directory. When the free space dwindles to the headroom limit (see Setting Log File Management Options), it enters a low space state and takes the following actions:
- If the autodelete option (discussed in Rolling Event Log Files) is enabled, then Traffic Server identifies previously-rolled log files (i.e., log files with the .old extension). It starts deleting files one by one, beginning with the oldest file, until it emerges from the low state. Traffic Server logs a record of all deleted files in the system error log.
- If the autodelete option is disabled or there are not enough old log files to delete for the system to emerge from its low space state, then Traffic Server issues a warning and continues logging until space is exhausted. When available space is consumed, event logging stops. Traffic Server resumes event logging when enough space becomes available for it to exit the low space state. To make space available, either explicitly increase the logging space limit or remove files from the logging directory manually.
You can run a cron(8) script in conjunction with Traffic Server to automatically remove old log files from the logging directory before Traffic Server enters the low space state. Relocate the old log files to a temporary partition, where you can run a variety of log analysis scripts. Following analysis, either compress the logs and move to an archive location, or simply delete them.
Setting Log File Management Options
To set log management options, follow the steps below:
- In the records.config file, edit the following variables
- Run the command traffic_line -x to apply the configuration changes.
Choosing Event Log File Formats
Traffic Server supports the following log file formats:
- Standard formats, such as Squid or Netscape; refer to Using Standard Formats.
- The Traffic Server custom format; refer to Using the Custom Format.
In addition to the standard and custom log file format, you can choose whether to save log files in binary or ASCII; refer to Choosing Binary or ASCII.
Event log files consume substantial disk space. Creating log entries in multiple formats at the same time can consume disk resources very quickly and adversely impact Traffic Server performance.
Using Standard Formats
The standard log formats include Squid, Netscape Common, Netscape extended, and Netscape Extended-2. The standard log file formats can be analyzed with a wide variety of off-the-shelf log-analysis packages. You should use one of the standard event log formats unless you need information that these formats do not provide. Refer to Using the Custom Format.
Set standard log file format options by following the steps below:
- In the records.config file, edit the following variables
- Edit the following variables to use the Squid format:
- To use the Netscape Common format, edit the following variables:
- To use the Netscape Extended format, edit the following variables:
- To use the Netscape Extended-2 format, edit the following variables:
- Run the command traffic_line -x to apply the configuration changes.
Using the Custom Format
The XML-based custom log format is more flexible then the standard log file formats and gives you more control over the type of information recorded in log files. You should create a custom log format if you need data for analysis that’s not available in the standard formats. You can decide what information to record for each Traffic Server transaction and create filters that specify which transactions to log.
The heart of the XML-based custom logging feature is the XML-based logging configuration file (logs_xml.config) that enables you to create very modular descriptions of logging objects. The logs_xml.config file uses three types of objects to create custom log files, as detailed below. To generate a custom log format, you must specify at least one LogObject definition (one log file is produced for each LogObject definition).
- The LogFormat object defines the content of the log file using printf-style format strings.
- The LogFilter object defines a filter so that you include or exclude certain information from the log file.
- The LogObject object specifies all the information needed to
produce a log file.
- The name of the log file. (required)
- The format to be used (required). This can be a standard format (Squid or Netscape) or
- a previously-defined custom format (i.e., a previously-defined LogFormat object).
- The file mode: ASCII, Binary, or ASCII_PIPE. The default is ASCII. The ASCII_PIPE mode writes log entries to a UNIX-named pipe (a buffer in memory); other processes can then read the data using standard I/O functions. The advantage of this option is that Traffic Server does not have to write to disk, which frees disk space and bandwidth for other tasks. When the buffer is full, Traffic Server drops log entries and issues an error message indicating how many entries were dropped. Because Traffic Server only writes complete log entries to the pipe, only full records are dropped.
- Any filters you want to use (i.e., previously-defined LogFilter objects).
- The collation servers that are to receive the log files.
- The protocols you want to log. If the protocols tag is used, then Traffic Server will only log transactions from the protocols listed; otherwise, all transactions for all protocols are logged.
- The origin servers you want to log. If the servers tag is used, then Traffic Server will only log transactions for the origin servers listed; otherwise, transactions for all origin servers are logged.
- The header text you want the log files to contain. The header text appears at the beginning of the log file, just before the first record.
- The log file rolling options.
In order to accomplish this, we
- edit the following variables in the records.config file:
- proxy.config.log.custom_logs_enabled
- In the logs_xml.config file
- Add LogFormat, LogFilters, and LogObject specifications to the configuration file.
- Save and close the logs_xml.config file.
- Run the command traffic_line -x to apply your configuration changes.
Creating Summary Log Files
Traffic Server performs several hundred operations per second; therefore, event log files can quickly grow to large sizes. Using SQL-like aggregate operators, you can configure Traffic Server to create summary log files that summarize a set of log entries over a specified period of time. This can significantly reduce the size of the log files generated.
To generate a summary log file, create a LogFormat object in the XML-based logging configuration file (logs_xml.config) using the SQL-like aggregate operators below. You can apply each of these operators to specific fields, over a specified interval.
- COUNT
- SUM
- AVERAGE
- FIRST
- LAST
To create a summary log file format, we
Define the format of the log file in logs_xml.config as follows:
<LogFormat>
  <Name = "summary"/>
  <Format = "%<operator(field)> : %<operator(field)>"/>
  <Interval = "n"/>
</LogFormat>
where operator is one of the five aggregate operators (COUNT, SUM, AVERAGE, FIRST, LAST), field is the logging field you want to aggregate, and n is the interval (in seconds) between summary log entries. You can specify more than one operator in the format line. For more information, refer to logs_xml.config.
Run the command traffic_line -x to apply configuration changes .
The following example format generates one entry every 10 seconds. Each entry contains the timestamp of the last entry of the interval, a count of the number of entries seen within that 10-second interval, and the sum of all bytes sent to the client:
<LogFormat>
  <Name = "summary"/>
  <Format = "%<LAST(cqts)> : %<COUNT(*)> : %<SUM(psql)>"/>
  <Interval = "10"/>
</LogFormat>
Important
You cannot create a format specification that contains both aggregate operators and regular fields. For example, the following specification would be invalid:
<Format = "%<LAST(cqts)> : %<COUNT(*)> : %<SUM(psql)> : %<cqu>"/>
Choosing Binary or ASCII
You can configure Traffic Server to create event log files in either of the following:
ASCII
These files are human-readable and can be processed using standard, off-the-shelf log analysis tools. However, Traffic Server must perform additional processing to create the files in ASCII, which mildly impacts system overhead. ASCII files also tend to be larger than the equivalent binary files. By default, ASCII log files have a .log filename extension.
Binary
These files generate lower system overhead and generally occupy less space on the disk than ASCII files (depending on the type of information being logged). However, you must use a converter application before you can read or analyze binary files via standard tools. By default, binary log files use a .blog filename extension.
While binary log files typically require less disk space, there are exceptions.
For example: the value 0 (zero) requires only one byte to store in ASCII, but requires four bytes when stored as a binary integer. Conversely: if you define a custom format that logs IP addresses, then a binary log file would only require four bytes of storage per 32-bit address. However, the same IP address stored in dot notation would require around 15 characters (bytes) in an ASCII log file. Therefore, it’s wise to consider the type of data that will be logged before you select ASCII or binary for your log files. For example, you might try logging for one day using ASCII and then another day using binary. If the number of requests is roughly the same for both days, then you can calculate a rough metric that compares the two formats.
For standard log formats, select Binary or ASCII (refer to Setting Standard Log File Format Options). For the custom log format, specify ASCII or Binary mode in the LogObject (refer to Using the Custom Format). In addition to the ASCII and binary options, you can also write custom log entries to a UNIX-named pipe (i.e., a buffer in memory). Other processes can then read the data using standard I/O functions. The advantage of using this option is that Traffic Server does not have to write to disk, which frees disk space and bandwidth for other tasks. In addition, writing to a pipe does not stop when logging space is exhausted because the pipe does not use disk space. Refer to logs_xml.config for more information about the ASCII_PIPE option.
Rolling Event Log Files
Traffic Server provides automatic log file rolling. This means that at specific intervals during the day or when log files reach a certain size, Traffic Server closes its current set of log files and opens new log files. Depending on the amount of traffic your servers are exposed to, you should roll log files several times a day. Rolling every six hours is a good guideline to start with.
Log file rolling offers the following benefits:
- It defines an interval over which log analysis can be performed.
- It keeps any single log file from becoming too large and helps to keep the logging system within the specified space limits.
- It provides an easy way to identify files that are no longer being used so that an automated script can clean the logging directory and run log analysis programs.
Rolled Log Filename Format
Traffic Server provides a consistent naming scheme for rolled log files that enables you to easily identify log files. When Traffic Server rolls a log file, it saves and closes the old file before it starts a new file. Traffic Server renames the old file to include the following information:
- The format of the file (such as squid.log).
- The hostname of the Traffic Server that generated the log file.
- Two timestamps separated by a hyphen (-). The first timestamp is a lower bound for the timestamp of the first record in the log file. The lower bound is the time when the new buffer for log records is created. Under low load, the first timestamp in the filename can be different from the timestamp of the first entry. Under normal load, the first timestamp in the filename and the timestamp of the first entry are similar. The second timestamp is an upper bound for the timestamp of the last record in the log file (this is normally the rolling time).
- The suffix .old, which makes it easy for automated scripts to find rolled log files.
Timestamps have the following format:
%Y%M%D.%Hh%Mm%Ss-%Y%M%D.%Hh%Mm%Ss
The following table describes the format:
- %Y
- The year in four-digit format. For example: 2000.
- %M
- The month in two-digit format, from 01-12. For example: 07.
- %D
- The day in two-digit format, from 01-31. For example: 19.
- %H
- The hour in two-digit format, from 00-23. For example: 21.
- %M
- The minute in two-digit format, from 00-59. For example: 52.
- %S
- The second in two-digit format, from 00-59. For example: 36.
The following is an example of a rolled log filename:
squid.log.mymachine.20110912.12h00m00s-20000913.12h00m00s.old
The logging system buffers log records before writing them to disk. When a log file is rolled, the log buffer might be partially full. If it is, then the first entry in the new log file will have a timestamp earlier than the time of rolling. When the new log file is rolled, its first timestamp will be a lower bound for the timestamp of the first entry.
For example, suppose logs are rolled every three hours, and the first rolled log file is:
squid.log.mymachine.20110912.12h00m00s-19980912.03h00m00s.old
If the lower bound for the first entry in the log buffer at 3:00:00 is 2:59:47, then the next log file will have the following timestamp when rolled:
squid.log.mymachine.20110912.02h59m47s-19980912.06h00m00s.old
The contents of a log file are always between the two timestamps. Log files do not contain overlapping entries, even if successive timestamps appear to overlap.
Rolling Intervals
Log files are rolled at specific intervals relative to a given hour of the day. Two options control when log files are rolled:
- The offset hour, which is an hour between 0 (midnight) and 23
- The rolling interval
Both the offset hour and the rolling interval determine when log file rolling starts. Rolling occurs every rolling interval and at the offset hour. For example, if the rolling interval is six hours and the offset hour is 0 (midnight), then the logs will roll at midnight (00:00), 06:00, 12:00, and 18:00 each day. If the rolling interval is 12 hours and the offset hour is 3, then logs will roll at 03:00 and 15:00 each day.
Setting Log File Rolling Options
To set log file rolling options and/or configure Traffic Server to roll log files when they reach a certain size, follow the steps below:
- In the records.config file, edit the following variables
- Run the command traffic_line -x to apply the configuration changes.
You can fine-tune log file rolling settings for a custom log file in the LogObject specification in the logs_xml.config file. The custom log file uses the rolling settings in its LogObject, which override the default settings you specify in Traffic Manager or the records.config file described above.
Splitting Event Log Files
By default, Traffic Server uses standard log formats and generates log files that contain HTTP & ICP transactions in the same file. However, you can enable log splitting if you prefer to log transactions for different protocols in separate log files.
ICP Log Splitting
When ICP log splitting is enabled, Traffic Server records ICP transactions in a separate log file with a name that contains icp. For example: if you enable the Squid format, then all ICP transactions are recorded in the squid-icp.log file. When you disable ICP log splitting, Traffic Server records all ICP transactions in the same log file as HTTP transactions.
HTTP Host Log Splitting
HTTP host log splitting enables you to record HTTP transactions for different origin servers in separate log files. When HTTP host log splitting is enabled, Traffic Server creates a separate log file for each origin server that’s listed in the log_hosts.config file. When both ICP and HTTP host log splitting are enabled, Traffic Server generates separate log files for HTTP transactions (based on the origin server) and places all ICP transactions in their own respective log files. For example, if the log_hosts.config file contains the two origin servers uni.edu and company.com and Squid format is enabled, then Traffic Server generates the following log files:
- squid-uni.edu.log
- All HTTP transactions for uni.edu
- squid-company.com.log
- All HTTP transactions for company.com
- squid-icp.log
- All ICP transactions for all hosts
- squid.log
- All HTTP transactions for other hosts
If you disable ICP log splitting, then ICP transactions are placed in the same log file as HTTP transactions. Using the hosts and log format from the previous example, Traffic Server generates the log files below:
- squid-uni.edu.log
- All entries for uni.edu
- squid-company.com.log
- All entries for company.com
- squid.log
- All other entries
Traffic Server also enables you to create XML-based Custom Log Formats that offer even greater control over log file generation.
Setting Log Splitting Options
To set log splitting options, follow the steps below:
- In the records.config file, edit the following variables
- Run the command traffic_line -x to apply the configuration changes.
Editing the log_hosts.config File
The default log_hosts.config file is located in the Traffic Server config directory. To record HTTP transactions for different origin servers in separate log files, you must specify the hostname of each origin server on a separate line in the log_hosts.config file. For example, if you specify the keyword sports, then Traffic Server records all HTTP transactions from sports.yahoo.com and www.foxsports.com in a log file called squid-sports.log (if the Squid format is enabled).
Note
If Traffic Server is clustered and you enable log file collation, then you should use the same log_hosts.config file on every Traffic Server node in the cluster.
To edit the log_hosts.config file follow the steps below:
In the log_hosts.config file, enter the hostname of each origin server on a separate line in the file, e.g.:
webserver1
webserver2
webserver3
Run the command traffic_line -x to apply the configuration changes.
Collating Event Log Files
You can use the Traffic Server log file collation feature to collect all logged information in one place. Log collation enables you to analyze a set of Traffic Server clustered nodes as a whole (rather than as individual nodes) and to use a large disk that might only be located on one of the nodes in the cluster. Traffic Server collates log files by using one or more nodes as log collation servers and all remaining nodes as log collation clients. When a Traffic Server node generates a buffer of event log entries, it first determines if it is the collation server or a collation client. The collation server node writes all log buffers to its local disk, just as it would if log collation was not enabled. Log collation servers can be standalone or they can be part of a node running Traffic Server.
The collation client nodes prepare their log buffers for transfer across the network and send the buffers to the log collation server. When the log collation server receives a log buffer from a client, it writes it to its own log file as if it was generated locally. For a visual representation of this, see the figure below.
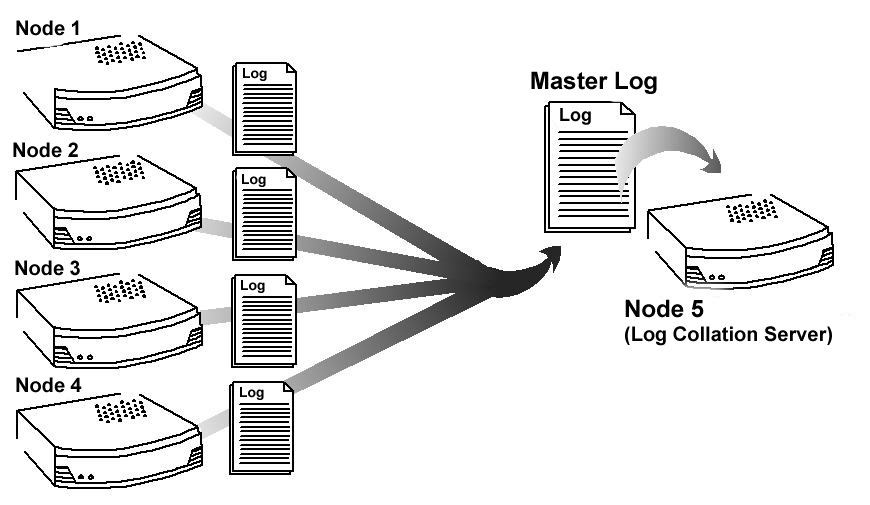
Log collation
If log clients cannot contact their log collation server, then they write their log buffers to their local disks, into orphan log files. Orphan log files require manual collation.
Note
Log collation can have an impact on network performance. Because all nodes are forwarding their log data buffers to the single collation server, a bottleneck can occur. In addition, collated log files contain timestamp information for each entry, but entries in the files do not appear in strict chronological order. You may want to sort collated log files before doing analysis.
To configure Traffic Server to collate event log files, you must perform the following tasks:
- Either Configure Traffic Server Node to Be a Collation Server or install & configure a Standalone Collator
- Configure Traffic Server Nodes to Be a Collation Clients.
- Add an attribute to the LogObject specification in the logs_xml.config file if you are using custom log file formats; refer to Collating Custom Event Log Files.
Configuring Traffic Server to Be a Collation Server
To configure a Traffic Server node to be a collation server, simply edit a configuration file via the steps below.
- In the records.config file, edit the following variables
- Run the command traffic_line -x to apply the configuration changes.
Note
If you modify the collation_port or secret after connections between the collation server and collation clients have been established, then you must restart Traffic Server.
Using a Standalone Collator
If you do not want the log collation server to be a Traffic Server node, then you can install and configure a standalone collator (SAC) that will dedicate more of its power to collecting, processing, and writing log files.
To install and configure a standalone collator:
Configure your Traffic Server nodes as log collation clients; refer to Configuring Traffic Server to Be a Collation Client.
Copy the traffic_sac binary from the Traffic Server bin directory and
Copy the libtsutil.so libraries from the Traffic Server lib directory to the machine serving as the standalone collator.
Create a directory called config in the directory that contains the traffic_sac binary.
Create a directory called internal in the config directory you created in Step 4 (above). This directory is used internally by the standalone collator to store lock files.
Copy the records.config file from a Traffic Server node configured to be a log collation client to the config directory you created in Step 4 on the standalone collator. The records.config file contains the log collation secret and the port you specified when configuring Traffic Server nodes to be collation clients. The collation port and secret must be the same for all collation clients and servers.
In the records.config file, edit the following variable
Enter the following command:
traffic_sac -c config
Configuring Traffic Server to Be a Collation Client
To configure a Traffic Server node to be a collation client, follow the steps below. If you modify the collation_port or secret after connections between the collation clients and the collation server have been established, then you must restart Traffic Server.
- In the records.config file, edit the following variables:
- proxy.local.log.collation_mode: 2 to configure this node as log collation client and send standard formatted log entries to the collation server. For XML-based formatted log entries, see logs_xml.config file; refer to Using the Custom Format.
- proxy.config.log.collation_host
- proxy.config.log.collation_port
- proxy.config.log.collation_secret
- proxy.config.log.collation_host_tagged
- proxy.config.log.max_space_mb_for_orphan_logs
- Run the command traffic_line -x to apply the configuration changes.
Collating Custom Event Log Files
If you use custom event log files, then you must edit the logs_xml.config file (in addition to configuring a collation server and collation clients).
To collate custom event log files
On each collation client, edit the :file:`logs_xml.config
Add the CollationHost attribute to the LogObject specification:
<LogObject>
  <Format = "squid"/>
  <Filename = "squid"/>
  <CollationHosts="ipaddress:port"/>
</LogObject>
where ipaddress is the hostname or IP address of the collation server to which all log entries (for this object) are forwarded, and port is the port number for communication between the collation server and collation clients.
Run the command traffic_line -L to restart Traffic Server on the local node or traffic_line -M to restart Traffic Server on all the nodes in a cluster.
Viewing Logging Statistics
Traffic Server generates logging statistics that enable you to see the following information:
- How many log files (formats) are currently being written.
- The current amount of space used by the logging directory, which contains all event and error logs.
- The number of access events written to log files since Traffic Server installation. This counter represents one entry in one file; if multiple formats are being written, then a single event creates multiple event log entries.
- The number of access events skipped (because they were filtered) since Traffic Server installation.
- The number of access events written to the event error log since Traffic Server installation.
You can retrieve the statistics via the Traffic Line command-line interface; refer to Monitoring Traffic.
Viewing Log Files
You can view the system, event, and error log files Traffic Server creates. You can also delete a log file or copy it to your local system if you have the correct user permissions. Traffic Server displays only one MB of information in the log file. If the log file you select to view is bigger than 1MB, then Traffic Server truncates the file and displays a warning message indicating that the file is too big.
Online Event Log XML Builder
If you need any assistance building your event log, you can try out our online log builder. This is a work in progress, so any comments, critique or suggestions are most welcome.
Example Event Log File Entries
This section shows an example log file entry in each of the standard log formats supported by Traffic Server: Squid, Netscape Common, Netscape Extended, and Netscape Extended-2.
Squid Format
The following figure shows a sample log entry in a squid.log file.
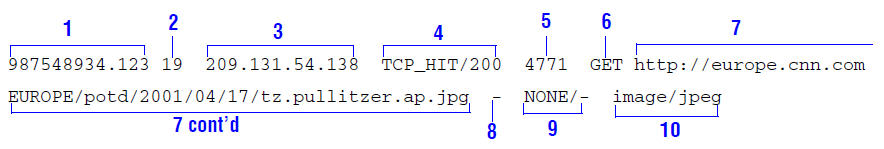
Sample log entry in squid.log
| Field | Symbol | Description |
|---|---|---|
| 1 | cqtq | The client request timestamp in Squid format; the time of the client request in seconds since January 1, 1970 UTC (with millisecond resolution). |
| 2 | ttms | The time Traffic Server spent processing the client request; the number of milliseconds between the time the client established the connection with Traffic Server and the time Traffic Server sent the last byte of the response back to the client. |
| 3 | chi | The IP address of the client’s host machine. |
| 4 | crc/pssc | The cache result code; how the cache responded to the request: HIT, MISS, and so on. Cache result codes are described here. The proxy response status code (the HTTP response status code from Traffic Server to client). |
| 5 | psql | The length of the Traffic Server response to the client in bytes, including headers and content. |
| 6 | cqhm | The client request method: GET, POST, and so on. |
| 7 | cauc | The client request canonical URL; blanks and other characters that might not be parsed by log analysis tools are replaced by escape sequences. The escape sequence is a percentage sign followed by the ASCII code number of the replaced character in hex. |
| 8 | caun | The username of the authenticated client. A hyphen (-) means that no authentication was required. |
| 9 | phr/pqsn | The proxy hierarchy route; the route Traffic Server used to retrieve the object. |
| 10 | psct | The proxy response content type; the object content type taken from the Traffic Server response header. |
Squid log in XML
This is the equivalent XML configuration for the log above:
<LogFormat>
  <Name = "squid"/>
  <Format = "%<cqtq> %<ttms> %<chi> %<crc>/%<pssc> %<psql> %<cqhm> %<cquc>
             %<caun> %<phr>/%<pqsn> %<psct>"/>
</LogFormat>
Netscape Common
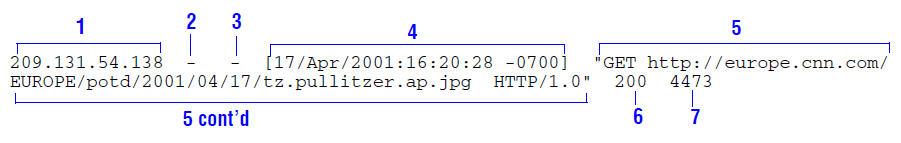
Sample log entry in common.log
| Field | Symbol | Description |
|---|---|---|
| 1 | chi | The IP address of the client’s host machine. |
| 2 | – | This hyphen (-) is always present in Netscape log entries. |
| 3 | caun | The authenticated client username. A hyphen (-) means no authentication was required. |
| 4 | cqtd | The date and time of the client request, enclosed in brackets. |
| 5 | cqtx | The request line, enclosed in quotes. |
| 6 | pssc | The proxy response status code (HTTP reply code). |
| 7 | pscl | The length of the Traffic Server response to the client in bytes. |
Netscape Common in XML
This is the equivalent XML configuration for the log above:
<LogFormat>
  <Name = "common"/>
  <Format = "%<chi> - %<caun> [%<cqtn>] \"%<cqtx>\" %<pssc> %<pscl>"/>
</LogFormat>
Netscape Extended
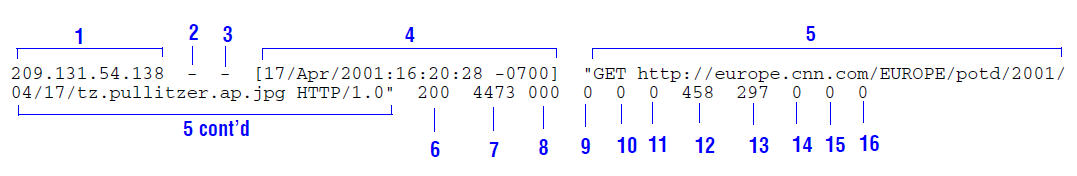
Sample log entry in extended.log
In addition to field 1-7 from the Netscape Common log format above, the Extended format also adds the following fields:
| Field | Symbol | Description |
|---|---|---|
| 8 | sssc | The origin server response status code. |
| 9 | sshl | The server response transfer length; the body length in the origin server response to Traffic Server, in bytes. |
| 10 | cqbl | The client request transfer length; the body length in the client request to Traffic Server, in bytes. |
| 11 | pqbl | The proxy request transfer length; the body length in the Traffic Server request to the origin server. |
| 12 | cqhl | The client request header length; the header length in the client request to Traffic Server. |
| 13 | pshl | The proxy response header length; the header length in the Traffic Server response to the client. |
| 14 | pqhl | The proxy request header length; the header length in Traffic Server request to the origin server. |
| 15 | sshl | The server response header length; the header length in the origin server response to Traffic Server. |
| 16 | tts | The time Traffic Server spent processing the client request; the number of seconds between the time that the client established the connection with Traffic Server and the time that Traffic Server sent the last byte of the response back to the client. |
Netscape Extended in XML
This is the equivalent XML configuration for the log above:
<LogFormat>
  <Name = "extended"/>
  <Format = "%<chi> - %<caun> [%<cqtn>] \"%<cqtx>\" %<pssc> %<pscl>
     %<sssc> %<sscl> %<cqbl> %<pqbl> %<cqhl> %<pshl> %<pqhl> %<sshl> %<tts>"/>
</LogFormat>
Netscape Extended2
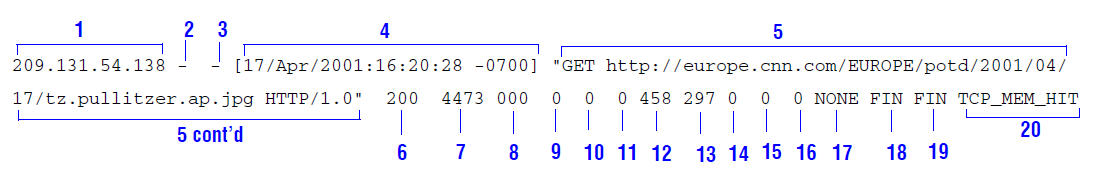
Sample log entry in extended2.log
In addition to field 1-16 from the log formats above, the Extended2 format also adds the following fields:
| Field | Symbol | Description |
|---|---|---|
| 17 | phr | The proxy hierarchy route; the route Traffic Server used to retrieve the object. |
| 18 | cfsc | The client finish status code: FIN if the client request completed successfully or INTR if the client request was interrupted. |
| 19 | pfsc | The proxy finish status code: FIN if the Traffic Server request to the origin server completed successfully or INTR if the request was interrupted. |
| 20 | crc | The cache result code; how the Traffic Server cache responded to the request: HIT, MISS, and so on. Cache result codes are described here. |
Netscape Extended2 in XML
This is the equivalent XML configuration for the log above:
<LogFormat>
  <Name = "extended2"/>
  <Format = "%<chi> - %<caun> [%<cqtn>] \"%<cqtx>\" %<pssc> %<pscl>
             %<sssc> %<sscl> %<cqbl> %<pqbl> %<cqhl> %<pshl> %<pqhl> %<sshl> %<tts> %<phr> %<cfsc> %<pfsc> %<crc>"/>
</LogFormat>
Squid- and Netscape-format: Cache Result Codes
The following table describes the cache result codes in Squid and Netscape log files.
- TCP_HIT
- A valid copy of the requested object was in the cache and Traffic Server sent the object to the client.
- TCP_MISS
- The requested object was not in cache, so Traffic Server retrieved the object from the origin server (or a parent proxy) and sent it to the client.
- TCP_REFRESH_HIT
- The object was in the cache, but it was stale. Traffic Server made an if-modified-since request to the origin server and the origin server sent a 304 not-modified response. Traffic Server sent the cached object to the client.
- TCP_REF_FAIL_HIT
- The object was in the cache but was stale. Traffic Server made an if-modified-since request to the origin server but the server did not respond. Traffic Server sent the cached object to the client.
- TCP_REFRESH_MISS
- The object was in the cache but was stale. Traffic Server made an if-modified-since request to the origin server and the server returned a new object. Traffic Server served the new object to the client.
- TCP_CLIENT_REFRESH
- The client issued a request with a no-cache header. Traffic Server obtained the requested object from the origin server and sent a copy to the client. Traffic Server deleted the previous copy of the object from cache.
- TCP_IMS_HIT
- The client issued an if-modified-since request and the object was in cache & fresher than the IMS date, or an if-modified-since request to the origin server revealed the cached object was fresh. Traffic Server served the cached object to the client.
- TCP_IMS_MISS
- The client issued an if-modified-since request, and the object was either not in cache or was stale in cache. Traffic Server sent an if-modified-since request to the origin server and received the new object. Traffic Server sent the updated object to the client.
- TCP_SWAPFAIL
- The object was in the cache but could not be accessed. The client did not receive the object.
- ERR_CLIENT_ABORT
- The client disconnected before the complete object was sent.
- ERR_CONNECT_FAIL
- Traffic Server could not reach the origin server.
- ERR_DNS_FAIL
- The Domain Name Server (DNS) could not resolve the origin server name, or no DNS could be reached.
- ERR_INVALID_REQ
- The client HTTP request was invalid. (Traffic Server forwards requests with unknown methods to the origin server.)
- ERR_READ_TIMEOUT
- The origin server did not respond to Traffic Server’s request within the timeout interval.
- ERR_PROXY_DENIED
- Client service was denied.
- ERR_UNKNOWN
- The client connected, but subsequently disconnected without sending a request.